Digital Population Twins for Predicting Rescue Services' Demand: initial results (as of December 2025)
The project Regional Forecasting Models and the Future Service Capacity of Rescue Departments uses a population model for the first time to produce accident forecasts. The population model is a digital twin of Finland’s population based on statistical data. In the project, probability-based forecasts have been developed on how the population and the number of accidents in different regions will evolve over the next twenty years. The accident types examined are residential building fires, traffic accidents, and forest fires.
This page presents the project’s first calculations, which will be refined and expanded based on user feedback. On that basis, a further developed version of the model and its user interface will be published in spring 2026.
Accidents are linked to the population: different population groups are associated with different risk factors, meaning they have different levels of susceptibility to being involved in different types of accidents. A person’s stage of life and life situation, lifestyle, form of housing, and behaviour all affect how likely they are to be involved in an accident.
To forecast how the number of different types of accidents may develop, it is important to identify what kinds of population groups live and move in each area, and how these groups change over time.
In addition, the probability data for these accident types has been linked to calculations of their direct and indirect costs. The resulting information makes it possible to examine the costs of accidents at a precise geographical level, for example by residential area, and to assess the resource needs they create. At its most detailed, the regional level of analysis is a 250 x 250 metre grid.
In the project, the calculation results form an evidence base on changes in the operating environment, the development in the number of rescue personnel, and the development in accident-related costs. This helps the management of rescue departments plan the use of resources more effectively and efficiently. The information also supports the future planning of new forms of cooperation and the service network of the wellbeing services counties.
The results presented on this page are based on data from the Kainuu Wellbeing Services County, but with the help of the interactive map, users can also explore calculations for the regions of Southwest Finland and North Karelia.
The project is funded by the Fire Protection Fund, and its implementers are the Kainuu Rescue Department, Taso Research Ltd, Sosped Center Ltd, and Hyvil. The project partners are the rescue departments of Southwest Finland and North Karelia.
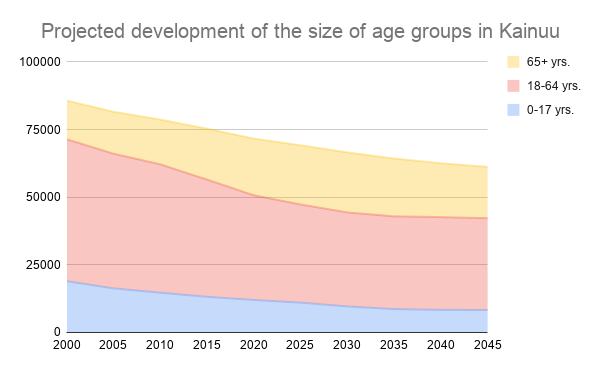
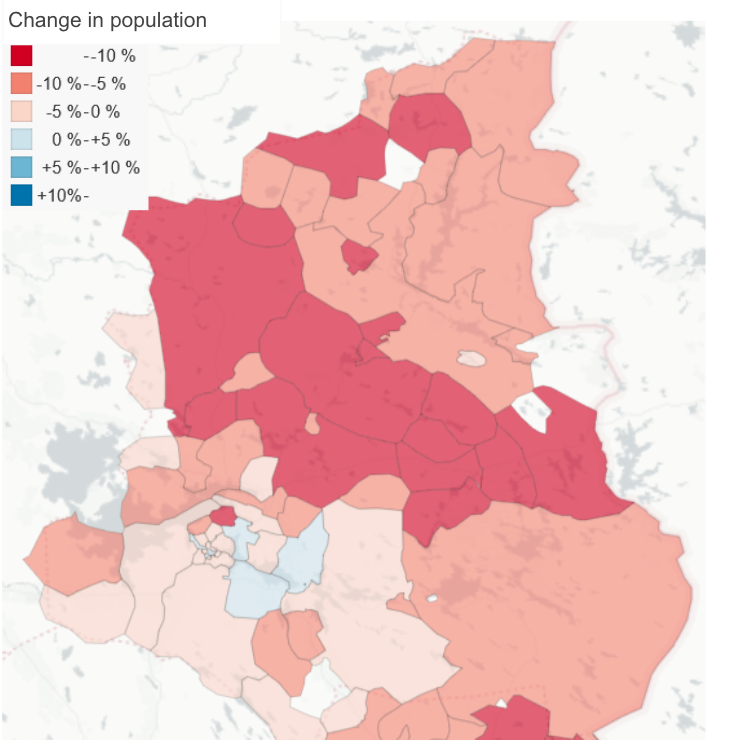
The population is changing — but at different rates in different areas
The population structure of different areas changes as a result of migration between and within municipalities, immigration, births, and deaths. This changes the operating environment of rescue departments and the demand for their services. Population change is not linear, and even within a single municipality, the direction and pace of demographic change can differ significantly from one area to another.
Information on accident risk factors can be linked to different population groups
However, forecasting the population size of different areas alone is not enough to produce forecasts for different types of accidents. It is also important to identify and predict what kinds of population groups live in each area now and in the future, and what kinds of accident risks are associated with each group.
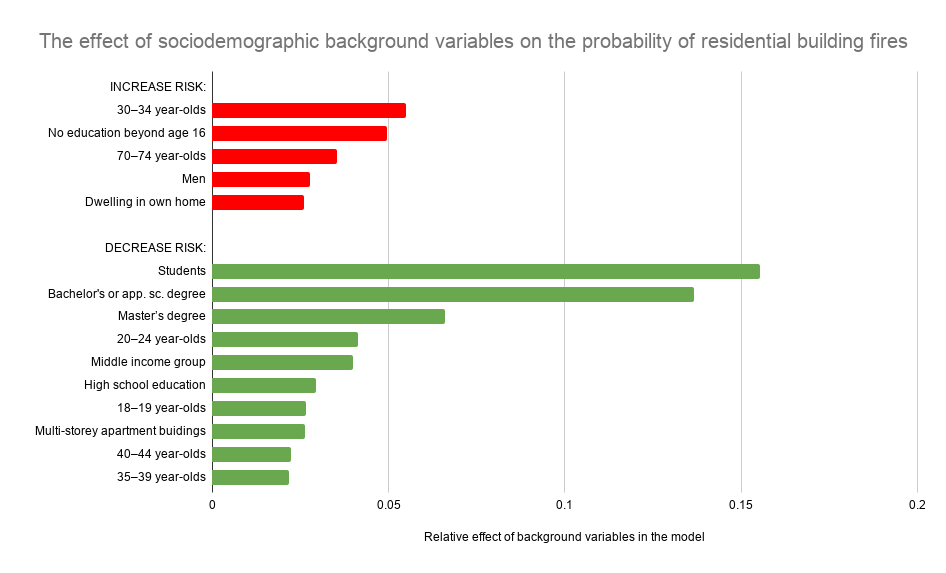
With the help of research data and statistics on the accident history of different areas, it is possible to identify the risk levels associated with different population groups. These are linked, among other things, to a person’s stage of life, life situation, and lifestyle.
In the Regional Forecasting Models project, the background variables used to explain variation in the risk of residential building fires, at the model’s current stage of development, are gender, age group, level of education, income level, employment status, form of housing, type of residential building, and family structure.
Accident numbers can be forecast by linking population-level risk data to the population model
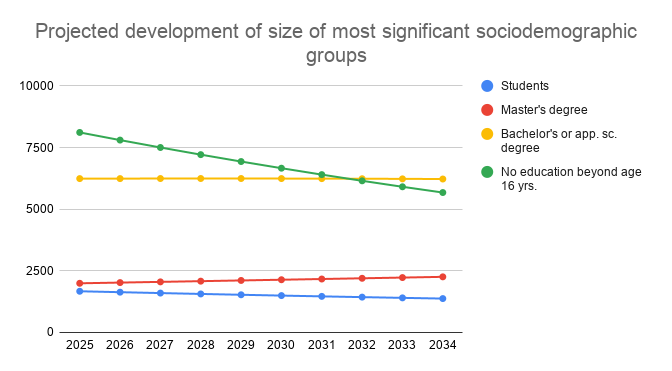
By combining information on the risk factors associated with different population groups with the regional population forecasts in the population model, we can calculate how the size of each population group and its regional distribution change over time. Once the risk exposure of different population groups is known, it becomes possible to produce probability-based forecasts of how the number of accidents will develop in different areas.
Accident forecasts do not indicate exactly how many accidents will occur in any given year. Instead, they provide a range within which the final number of accidents is likely to fall.
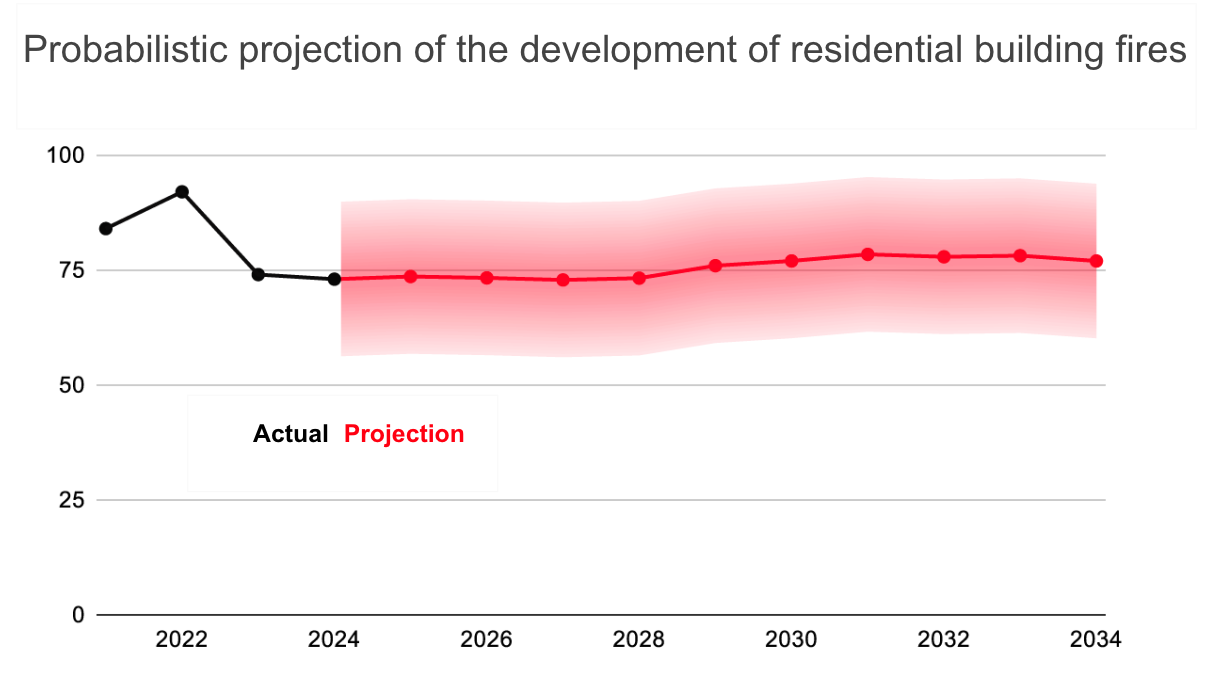
Explore regional probabilities of residential building fires yourself
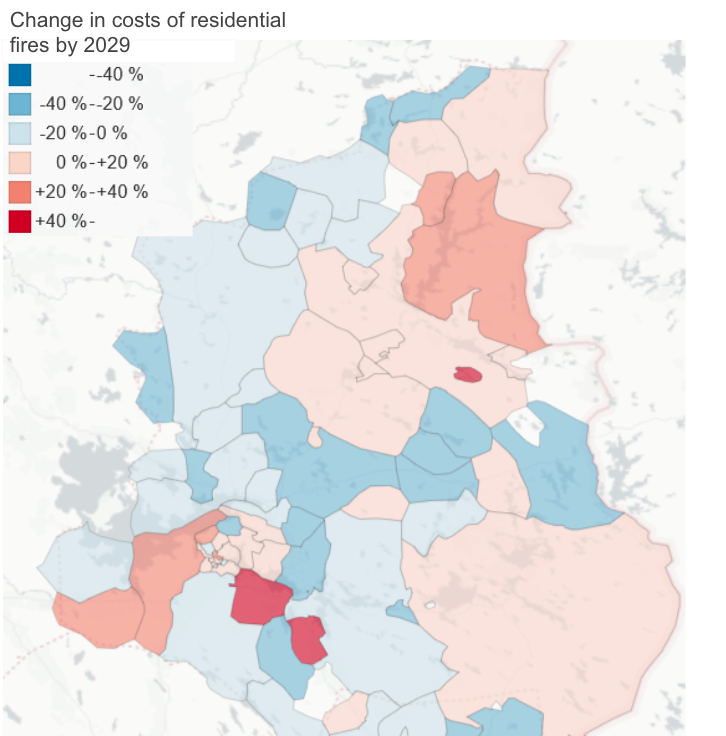
The most important aspect of accident forecasts is not the exact predicted number of accidents, but rather their direction of change over time and across locations. In which areas is accident risk increasing? At what rate? In which areas is accident risk decreasing? Which population groups make an area particularly risk-prone now, and which will do so in the future?
In the interactive map, you can explore probability-based estimates of the number and locations of residential building fires in 2034.
In addition to fire probabilities, the map interface also allows you to examine how the costs caused by these fires are expected to develop across different areas. The method used for cost calculation is explained further down on this page.
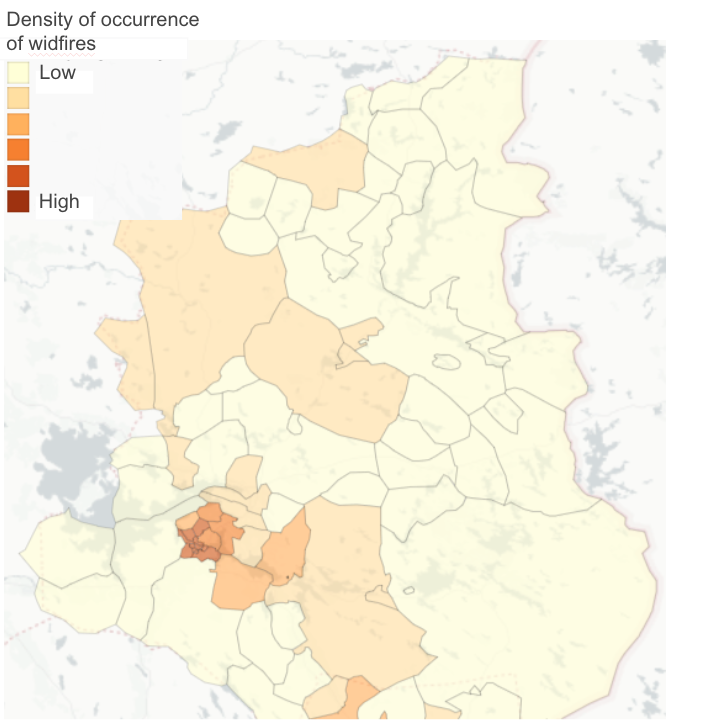
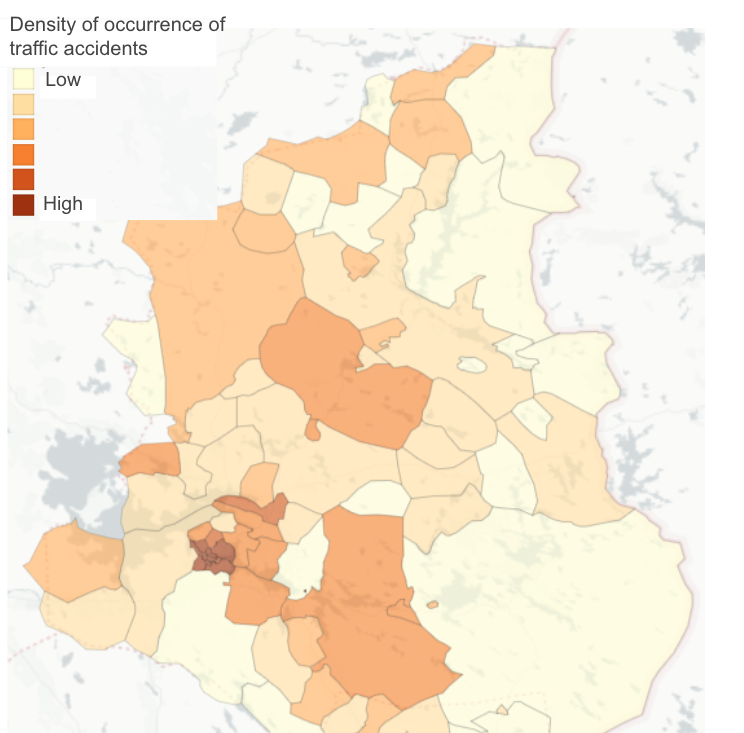
The map interface also presents the most likely locations of wildfires and traffic accidents. Currently the map's user interface is only available in Finnish.
Wildfires and traffic accidents
Wildfires and traffic accidents are difficult to forecast on the basis of the available data, because they are not directly linked to where people live. However, the map can illustrate the areas where these types of accidents have been concentrated so far. This provides an indication of where future accidents are likely to occur, as they are particularly connected to patterns and volumes of movement.
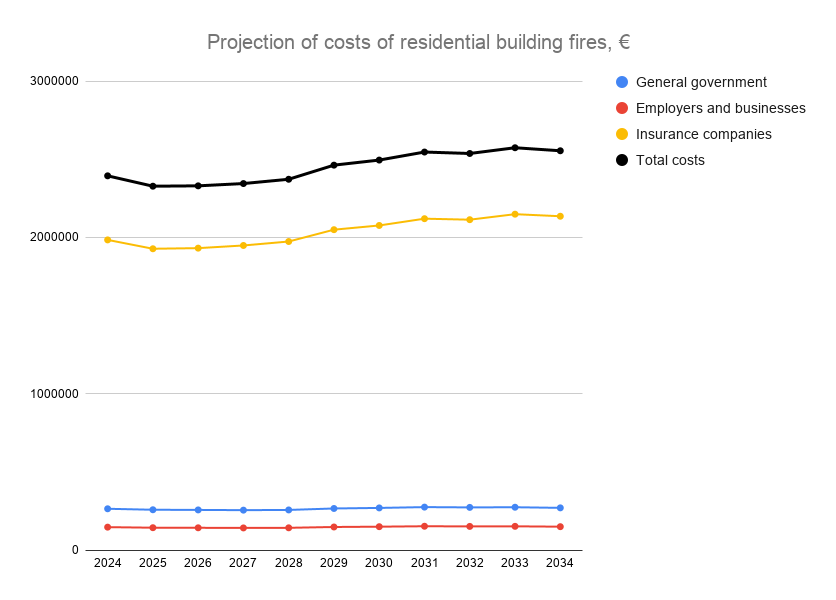
The societal costs of accidents
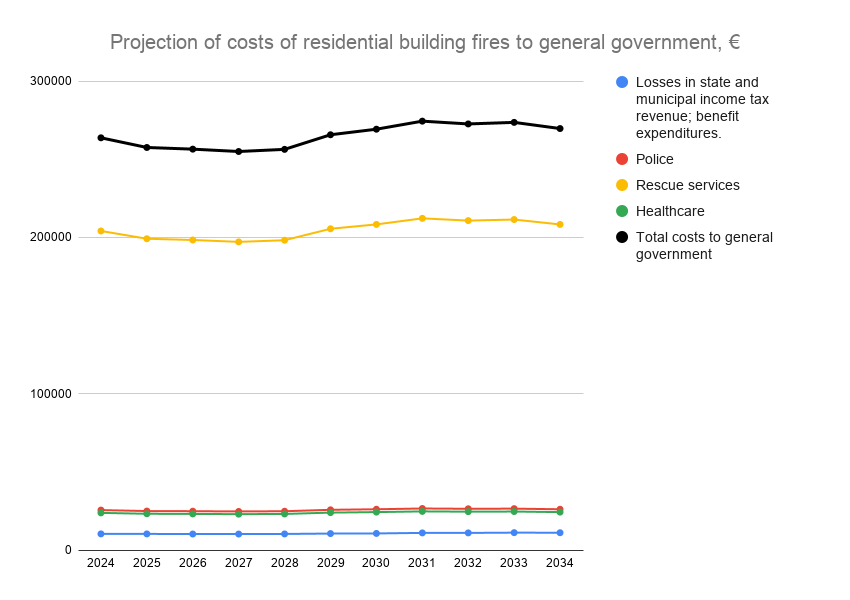
So far, the project has examined the direct and indirect costs of residential building fires. The costs caused by traffic accidents and forest fires will be added to the model in the near future.
Direct costs include the costs of rescue operations, healthcare (emergency medical services, primary healthcare, specialised healthcare, and rehabilitation), and the police, as well as social benefits such as sickness allowance and disability pension, and property damage. The latter is paid for by insurance companies and private individuals. Statistics Finland data on regional housing sale prices has been used to calculate property damage.
Indirect costs include the costs arising from absences from work and exits from the labour market caused by injuries (and, where applicable, deaths), tax revenue losses in state and municipal income taxation, and the value of lost labour input to the national economy. These costs fall on different levels of public administration, employers, and, in the case of productivity losses, more broadly on the economy as a whole.
A comprehensive assessment of the costs caused by different types of accidents helps evaluate, from an impact perspective, how much resource should be invested in rescue services and preventive measures.
The wide-ranging costs of accidents are borne by many different payers. By making this visible, we can, at best, support cross-administrative discussion and coordination to improve both safety and economic efficiency.
Using the information in rescue service management
Until now, it has not been possible to flexibly examine the risk factors and probabilities of different types of accidents at a detailed regional level and as they change over time. This creates new opportunities to reduce accidents and their costs through a more evidence-based approach. For example, the model helps in planning and assessing possible changes to the service network, the recruitment and more flexible use of personnel resources, and investments in accident prevention.
The evidence base provided by the model is particularly valuable from the perspective of service integration.
The model makes it possible to identify which population groups would be most suitable targets for preventive measures carried out jointly by different service providers, where these groups live, and how their numbers are expected to change.
So far, the model has only been applied to the information needs of the rescue sector, but by adding more data sources it will in future be developed to provide regional foresight information for use in areas such as social and healthcare service planning, service network planning, land-use planning, and preparedness for comprehensive security.
The project Regional Forecasting Models and the Future Service Capacity of Rescue Departments will end on 31 May 2026. During spring 2026, the model will be refined and deepened through dialogue with representatives of rescue departments. The aim of these discussions is to identify more precisely under what conditions the model can be adopted as part of rescue departments’ planning work, and which preparation and decision-making needs should be given particular attention in its further development.
If you would like to hear more about the project and its progress, please contact:
Peter Tattersall, Project Manager: peter.tattersall@kainuu.fi